In large-scale farms in China, an all-in/all-out production system is commonly adopted, designed to streamline management, reduce disease transmission, and enhance production efficiency. However, while this system promotes uniform growth, it fails to account for individual variations in growth among pigs. Approximately 10-15% of pigs within a batch display slow growth. These slow-growing pigs are often sold at discounted prices or require extended periods to reach a suitable slaughter body weight (BW), thereby affecting farm turnover rates and economic benefits.
A recent study conducted by researchers from Xichang University in China and the Shandong Engineering Research Center, part of the Shandong New Hope Liuhe Group, aims to tackle the pressing issue of identifying slow-growing pigs. It highlights the importance of early detection and management of these individuals, which is crucial for improving overall farm productivity and minimizing economic losses.
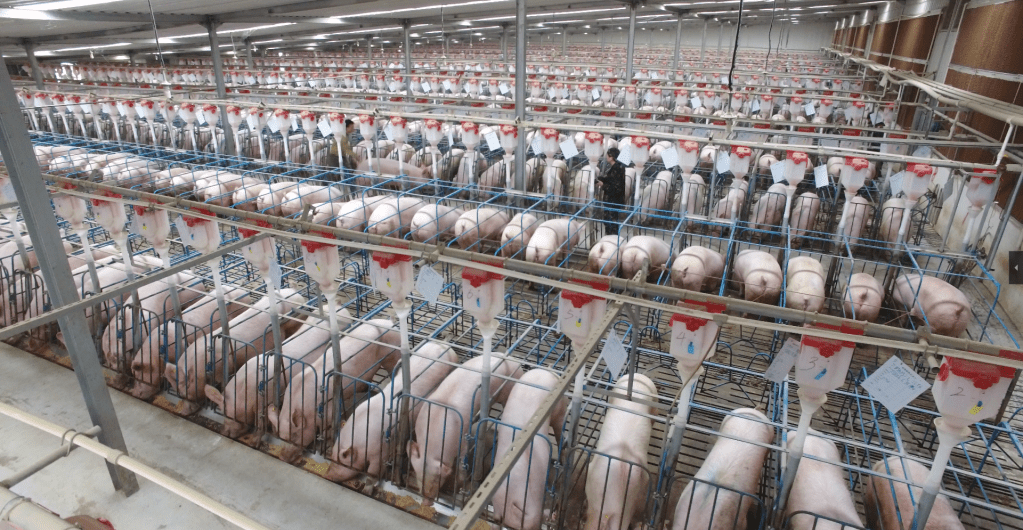
Identifying slow-growing pigs
This study took place on a commercial pig farm housing 8000 fattening pigs in Shandong province.
A total of 79 pigs aged 104 days (41 females and 38 males (castrated); (Large White × Landrace) × Duroc) were allocated into three groups 25-27 pigs/group, as High BW (42.5 kg - 55.1 kg), Medium BW (25 pigs, 32.6 kg- 42.4 kg) and Low BW (18.9 kg - 32.5 kg)
They measured the pigs at ages 104 to 202 days old to identify slow-growing pigs. Pigs identified with a slaughter BW below 110 kg at approximately 200 days were classified as slow-growing.
Measurements included data on body weight (BW), feed intake, and body condition score (BCS) collected through non-invasive nail caliper measurements. It helps farmers to quickly gauge performance without the stress and labor involved in traditional weighing methods.
| Diets | |||
| 71–118 d | 119–155 d | 156–220 d | |
| Ingredients, % | |||
| Maize | 51.316 | 53.145 | 51.884 |
| Soybean meal 43 | 13.34 | 11.933 | 9.647 |
| Wheat | 23 | 23 | 27 |
| Rice bran | 8 | 8 | 8 |
| Calcium carbonate | 1.296 | 1.159 | 1.101 |
| Calcium hydrogen phosphate III | 0.857 | 0.873 | 0.715 |
| L-lysine monohydrochloride (98.5%) | 0.6 | 0.574 | 0.554 |
| Soybean oil | 0.447 | 0.207 | 0.055 |
| Sodium chloride (98.5%) | 0.36 | 0.36 | 0.36 |
| Trace mineral and vitamin mixture* | 0.23 | 0.23 | 0.205 |
| L-Threonine (98.5%) | 0.192 | 0.188 | 0.185 |
| DL-Methionine(98.5%) | 0.173 | 0.153 | 0.132 |
| L-Threonine (25%) | 0.159 | 0.149 | 0.132 |
| Xylanase | 0.02 | 0.02 | 0.02 |
| Phytase | 0.01 | 0.01 | 0.01 |
Ingredient and nutrient composition of diets for commercial pigs at different growth stages.
(I’ve only included the key ingredients here due to space constraints. If you’d like to see the complete formula, just let me know)
| Composition | |||
| Dry matter, % | 86.28 | 86.19 | 86.17 |
| Moisture, % | 13.72 | 13.81 | 13.83 |
| Ash, % | 4.73 | 4.55 | 4.32 |
| Crude protein, % | 15.5 | 15 | 14.5 |
| Ether extract, % | 3.89 | 3.69 | 3.62 |
| Crude fiber, % | 2.66 | 2.61 | 2.62 |
Nutrient composition of diets for commercial pigs at different growth stages.
Why weighing important?
In practical settings, direct weighing methods can be labor-intensive and may disrupt feeding behavior, whereas indirect methods, such as measuring body dimensions or utilizing machine vision technologies, often face barriers related to cost and technical complexity. That’s why many farmers resort to visual estimation based on experience, which can lead to varying degrees of accuracy.
The findings from this study advocate for a non-invasive approach to BW estimation using BCS, making it accessible to large-scale producers and helping to maintain productivity without compromising the pigs’ welfare.
They checked feed intake, feeder occupation time, BW, and animal identity every time when a pig visited the feeder from 104 to 202 days old. The BW for 24 and 70 days old were obtained through precise individual weighing methods. Specifically, at 24 days of age, each pig was individually weighed using an electronic scale while conventional ear tags were applied. Similarly, at 70 days old, those pigs were weighed again using an electronic platform scale during the process of installing radio frequency identification (RFID) electronic ear tags.
Biomarkers: indicators of growth issues
Beyond monitoring weight and feeding behavior, the study also sought to identify potential biomarkers that could serve as indicators of slow growth. Importantly, the researchers observed that levels of white blood cell count, insulin-like growth factor binding protein-3, and blood urea nitrogen could provide valuable insights into the health statuses of pigs, offering avenues for early detection of growth issues. These biomarkers reflect the nutritional and health status of the pigs, which may be influenced by various factors, such as sub-clinical infections, stress responses, and deficiencies in essential nutrients.
Health issues a key indicators of performance
To understand the background of mixed infection in these pigs, at the start of the study, porcine circovirus 2 (PCV2), porcine circovirus 3 (PCV3), porcine reproductive and respiratory syndrome virus (PRRSV), pseudorabies virus glycoprotein E (PRV-gE), classical swine fever virus (CSFV), porcine epidemic diarrhea virus (PEDV), rotavirus (RV) and lawsonia intracellularis (LI) were detected using the real-time PCR.
The pigs were only vaccinated against pseudorabies and classic swine fever aged 56 and 84 days.
The study highlighted the impact of sub-clinical infections on pig growth, revealing mixed pathogen infections with high rates of PRV-gE, RV, and LI. The prevalence of PRRSV and PCV2 varied based on factors such as age, body weight, immune status, and environment, while CSFV and PEDV were undetected, suggesting the effectiveness of control measures. This may explain the low correlation between clinical scores and body weight, as infections can lead to appetite changes and growth decline. Although WBC levels were higher in one group, no significant differences in IFN-γ and TNF-α were observed, with TNF-α inversely related to body weight. Limited blood sampling restricted the correlation analysis, indicating a need for more frequent sampling in future research.
| Pathogen | High body weight | Medium body weight | Low body weight |
| PCV2 | 22.2% | 36.0% | 22.2% |
| PCV3 | 37.0% | 20.0% | 37.0% |
| PRRSV | 11.1% | 12.0% | 22.2% |
| PRV-gE | 70.4% | 56.0% | 74.1% |
| CSFV | 0.00% | 0.00% | 0.00% |
| PEDV | 0.00% | 0.00% | 0.00% |
| RV | 92.6% | 92.0% | 100% |
| LI | 96.3% | 92.0% | 92.6 |
Above are the prevalence of selected pathogens in commercial pigs with different body weights.
Enhancing farm management: strategies for early detection and intervention
The broader implications of this research extend to improving overall farm management. By integrating simple yet effective assessment methodologies, pig farmers could optimize growth monitoring practices and enhance management decisions.
Combining growth data with health indicators could aid in the early identification of individuals with slow growth, enabling targeted interventions to improve feed efficiency, health measures, and overall pig performance.
Moreover, the study emphasizes the necessity of considering environmental and management factors when assessing pig performance. Housing and management conditions in large-scale pig farms significantly affect both health and growth rates. Thus, understanding these relationships allows farmers to create optimal conditions that support the rapid growth of commercial pigs.
The impact of slow-growing pigs on farm profitability
The challenge of slow growth is exacerbated in markets where low prices can force discounted sales of underperforming pigs.
The research found that profitability across all BW groups is highly sensitive to fluctuating market conditions, with feed costs identified as a significant factor influencing overall economic viability. Notably, pigs in lower BW categories performed better in low-price markets but faced delayed break-even points under medium to high-price scenarios.
The analysis considered market conditions in China and the United States, including swine prices, feed costs, fixed expenses, and piglet prices. Economic returns were highly sensitive to fluctuations in these factors, with feed costs proving critical for efficiency. In low market price scenarios, the low BW group reached break-even points on par with other groups, while in medium and high price conditions, they reached break-even later.
Economic performance evaluation
The BWs of three groups of pigs from 104 to 201 days old, along with live pig market prices, feed prices, fixed costs, and piglet prices were used to calculate the revenues. The specific indicator settings and calculation formula are presented in this Table.
| Indicators | Setting of reference prices | Symbol | |||
| Low | Medium | High | |||
| Live pig market prices (USD/kg) | 2 | 3 | 4 | A | |
| Piglet prices (USD) | 30 | 40 | 50 | B | |
| Fixed costs (USD/kg/pig) | 0.2 | C | |||
| Feed prices (USD/kg) | For weaned pigs, nursery pigs, and early-stage growing pigs (21–103 d) | 0.75 | 0.65 | 0.54 | D1 |
| For growing-finishing pigs (104–201 d) | 0.5 | 0.43 | 0.36 | D2 | |
| Feed intake (kg) | For weaned pigs, nursery pigs, and early-stage growing pigs (21–103 d) | 81.56 | 56.3 | 37.64 | E1 |
| For growing-finishing pigs (104–201 d) | Cumulative average feed intake to date | E2 | |||
| Body weights (kg) | The average body weights of each group on the day of sale | F | |||
| Calculation formula | |||||
| Revenue = A×F-B-C×F-D1×E1-D2×E2 | |||||
These findings highlight the need for adaptive management strategies tailored to market conditions and BW characteristics. Producers should consider focusing on low BW pigs during low price periods and higher BW groups when prices rise for better economic returns. This analysis serves as a valuable reference for optimizing economic outcomes in pig farming.
Conclusion
Identifying slow-growing pigs through growth performance and health indicators is a critical area of investigation that can help transform operational efficiency within the commercial pig industry. This study not only contributes valuable insights into the identification and management of slow growers but also proposes practical methodologies that can be adopted by farmers. As the agricultural sector continues to seek ways to enhance productivity and profit margins, such research will remain pivotal in guiding future practices and policies aimed at sustaining the economic viability of large-scale pig farming. By continuing to delve into the dynamics of pig growth and health, we can ensure a more efficient and profitable future for the industry.
By Ha Thu

Leave a comment